The LCR meter I built and described in previous posts has some issues. In this post I’ll describe how I tried to solve them.
Observed Issues
Looking at the test results for measurements on resistors and precision capacitors I was convinced that both hardware and firmware were working correctly. However, the readings for some electrolytic capacitors were off by a considerable margin and I had no clue what could be the cause of this.
I also observed, that if I put a resistor in series with a film capacitor I could provoke the same behaviour. Obviously the device could handle pure resistors and pure capacitors but had difficulties with capacitors with a non-negligible ESR.
Comparing the voltages measured by the LCR meter with the readings of a DMM connected to the input of one of the DACs it became clear that the hardware was ok but in some cases the Lock-In algorithm combined with the downsampling filter produced inexact results.
I therefore decided to rip these software components out and use a different approach.
New Architecture
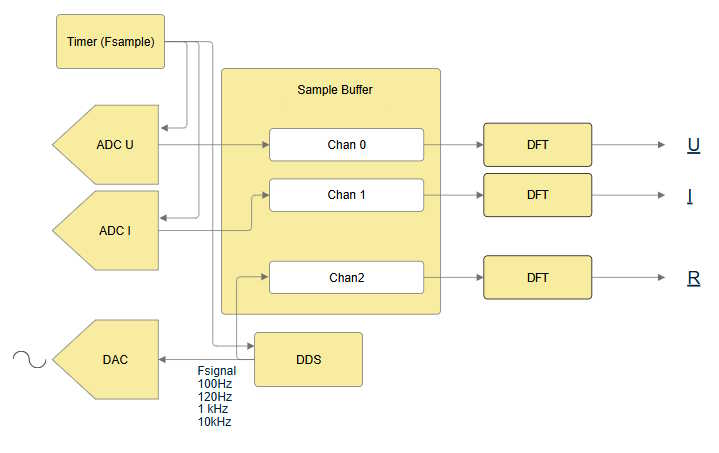
This is how it now works. A timer running at the sampling frequency triggers the conversion of the two ADC channels and the simultaneous computation of a new signal sample in the DDS sine wave generator. (No changes here.)
The new sample is output by the DAC and also fed into the reference channel of the sample buffer. The other two channels of the sample buffer are fed by the outputs of the two ADCs. To compute amplitude and phase of the channel signals we take the DFT of the buffer contents and get the complex values U, I, R. By comparing U with R and I with R we can compute the absolute phases of the voltage and current signals. With an ideal analog frontend we would not need R and could compute the impedance as Z = U / I. But as the analog frontend introduces additional phase shifts we need to take these into account. To measure the phase shifts in a calibration procedure we therefore need R as a phase reference.
The difference between the new architecture and the old one is mainly in how the filtering is done. Both compute a DFT on the signal frequency but the original method averaged the output using a downsampling filter with a filter length unrelated to the signal whereas the new one averages over exactly an integer number of signal periods in the sample buffer which lead to significantly better results.
Test Results
Tests using a decade resistor
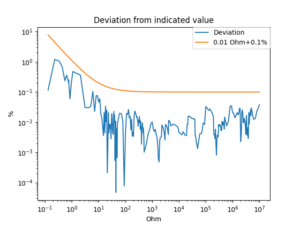
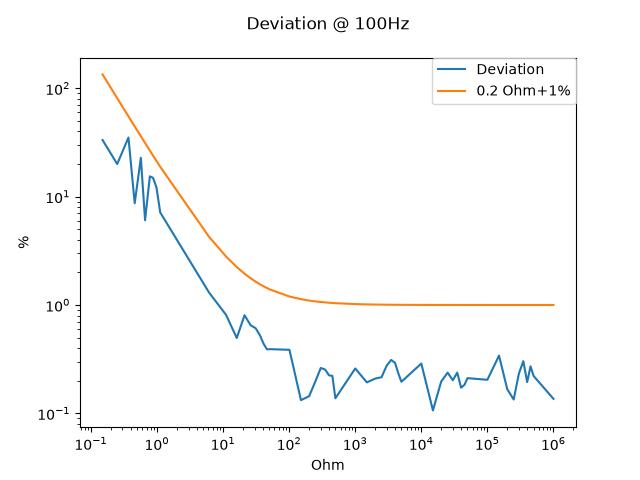
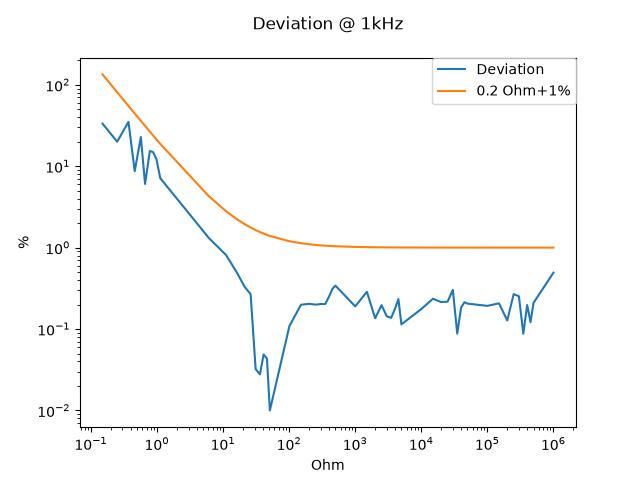
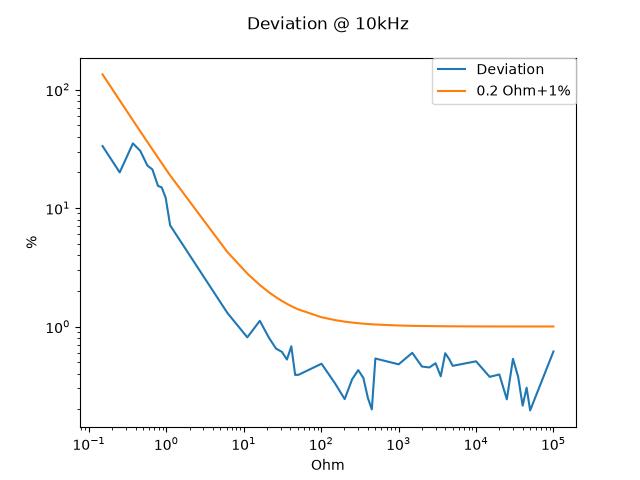
These measurements were taken using my programmable decade resistor (0.1 Ohm + 0.1%). The usable range for resistance measurements is 1 MOhm for frequencies up to 1 kHz and 100 kOhm for 10 kHz.
Tests using a decade capacitor
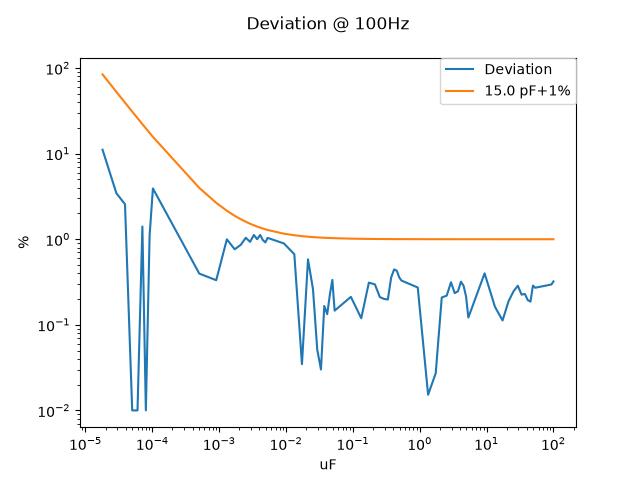
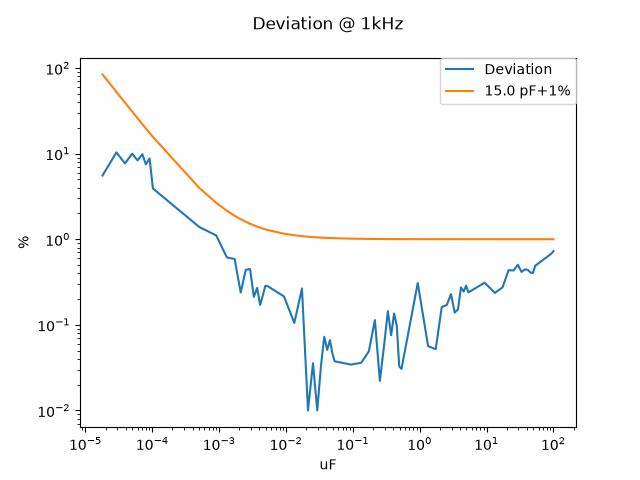
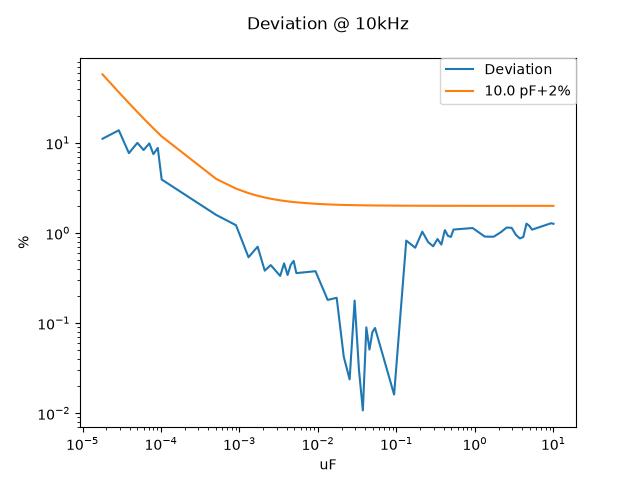
These tests were made using my programmable decade capacitor (10 pF+0.2%). The usable range for capacitance measurements is restricted to 10 uF for a frequency of 10kHz.
Tests using a set of small ceramic capacitors
In the diagrams above the results in the low pF region are dominated by the decade’s stray capacitances. To get more realistic results for small capacitances I prepared a set of calibrated SMD capacitors. Here are the results for this set.
| Capacitance | Measured (1 kHz) | Measured (10 kHz) |
|---|---|---|
| 1.4 pF | 1 pF | 2 pF |
| 2.7 pF | 3 pF | 3 pF |
| 5.5 pF | 5 pF | 5 pF |
| 11.0 pF | 11 pF | 10 pF |
| 23.1 pF | 23 pF | 22 pF |
| 47 pF | 47 pF | 46 pF |
| 100.2 pF | 99 pF | 99 pF |
| 220.0 pF | 221 pF | 220 pF |
| 458.5 pF | 457 pF | 457 nF |
| 1.004 nF | 1.00 nF | 1.00 nF |
| 4.806 nF | 4.80 nF | 4.75 nF |
| 10.200 nF | 10.2 nF | 10.1 nF |
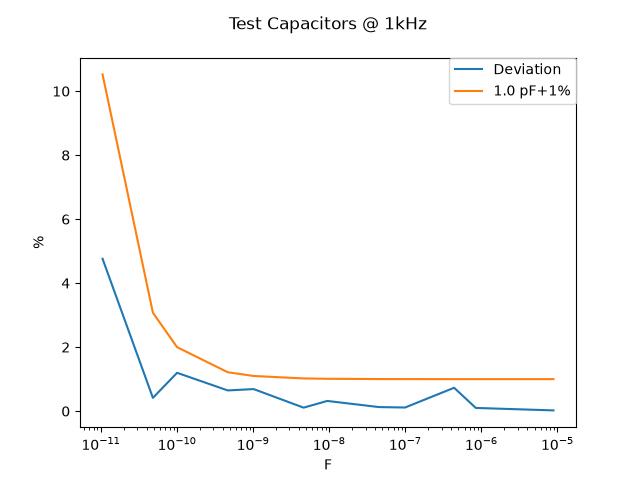
Tests using a set of ceramic and electrolytic capacitors
With the original design these tests failed for capacitances in the uF region. Now the readings are as expected.
Tests on Inductors
These are the results of measurements on a set of inductors I have. Readings above 10 uH are spot on.
| Inductance | Measured (10 kHz) |
|---|---|
| 1.2 uH | 0.84 uH |
| 10.6 uH | 11 uH |
| 284.5 uH | 284 uH |
| 1.03 mH | 1.0 mH |
| 10.36 mH | 10 mH |
| 102.4 mH | 102 mH |
| Inductance | Measured (100 Hz) |
|---|---|
| 14.8 H (iron core) | 15 H |
Statistics Function
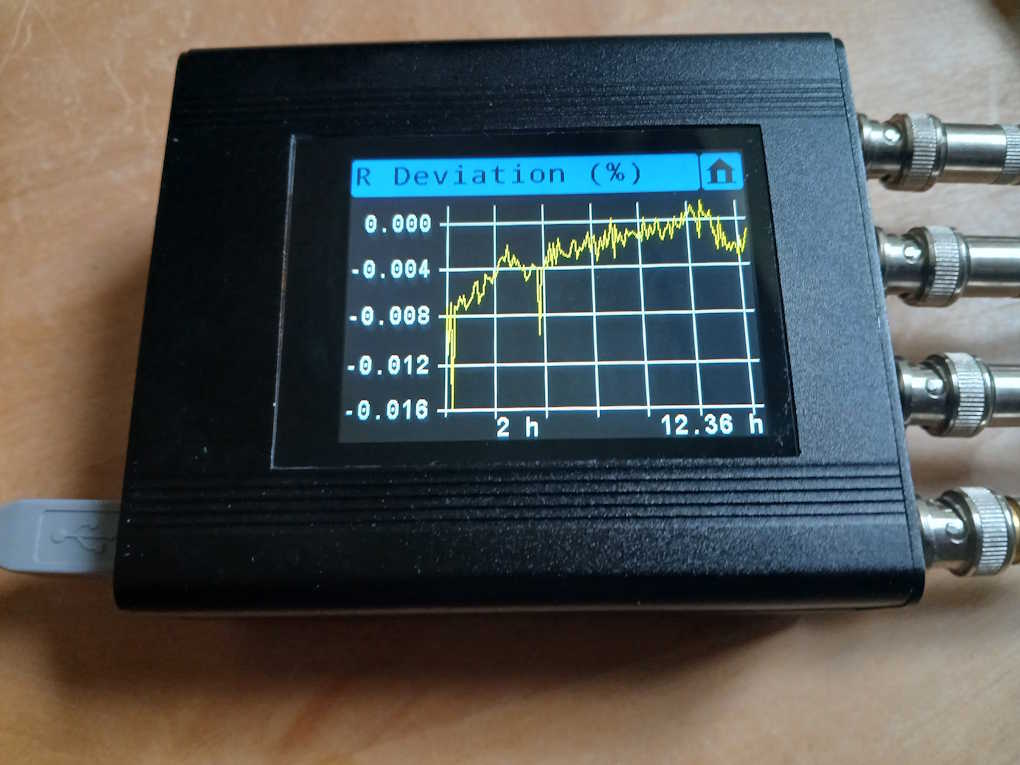
The statistics function allows you to monitor measurement results over time. (See picture at the top.)
Sorting Function
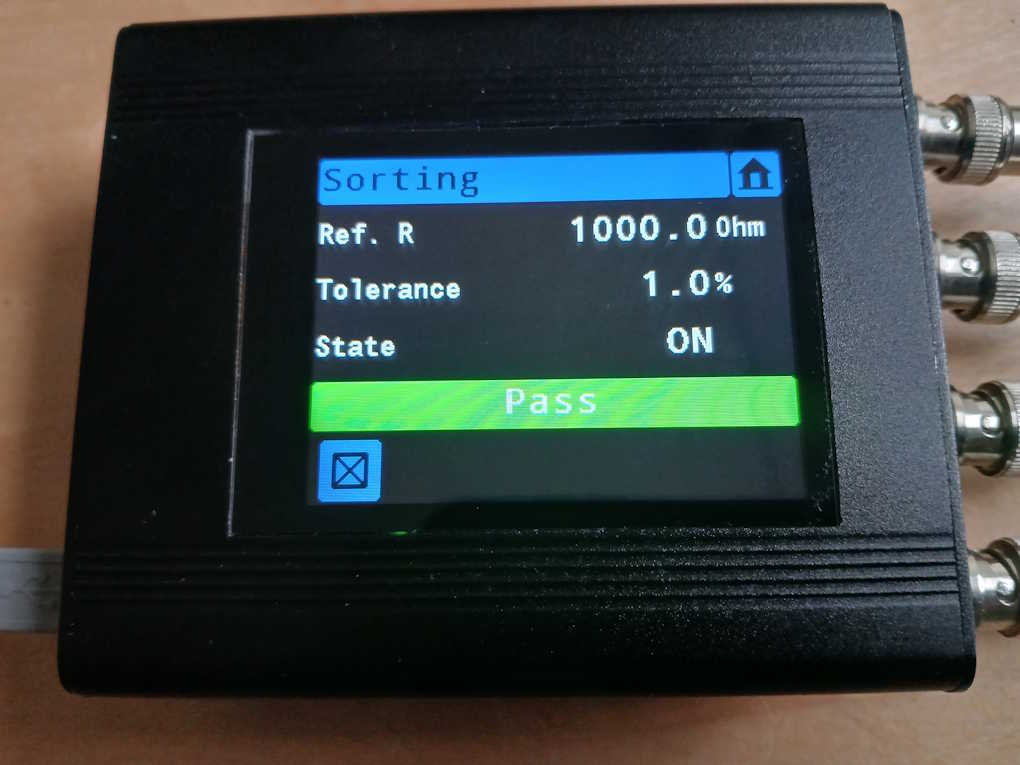
The sorting function allows for quick testing of components. You can set a reference resistance/capacitance/inductance and a tolerance in percent. Once the component is connected the device indicates whether the component’s value is within the specified range with a pass/fail text on the screen.
Final Remarks
I think it could be shown that it is possible to build an LCR meter which mainly relies on the analog components of the MCU. The device has its limitations but is perfectly usable in practical applications. It could be even more usable if it was battery powered. I may add this in a future upgrade.
This was a long project and also a learning experience. The good results for pure resistances and pure capacitances had me believe that the algorithm I chose was working correctly and would also perform well for components with a larger ESR. Unfortunately this was not the case and it was only after simulating the hardware over again and taking measurements that I threw this assumption overboard.
Schematics, Gerbers and firmware can be found in the Download section.