You are currently viewing A DIY LCR Meter – Part 7

A DIY LCR Meter – Part 7

In this post I am going to talk about revision 2 of the PCB and show some test results.         

PCB Revision 2

Revision 2 of the PCB includes these changes

  • Fixed layout bugsRemoved unnecessary capacitors
  • Made DC offset optional
  • Refactored signal conditioning for the I-channel
  • Distributed gain in the I-channel over two stages

PCBWay offered to sponsor this board. Thank you to PCBWay! As this was my first order from PCBWay I was curious how the board would turn out. The ordering process was very straightforward: upload Gerber file, set a few configuration options and off you go. I decided to have the solder mask in blue, which they offer at no additional cost. Other than that I went with the default. It should also be noted that they use an inner copper layer weight of 1oz as a standard. Production started right away and after one week I had the board.

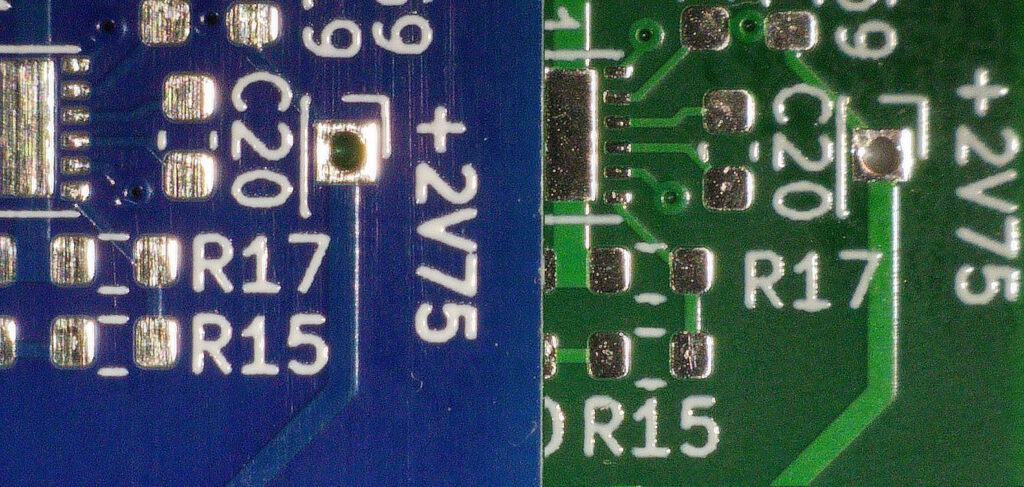
To compare the two revisions I put two boards side by side under the microscope and selected a region with only minor modifications.

PCB Comparison
Left: PCBWay, right:JLCPCB

Several things can be observed:

  • The silk screen on the left board looks cleaner. (Look at the horizontal bars in the “1” of “R17” or the horizontal markers of R15 and R17.)
  • The surfaces of the pads are different. The pads on the left board appear shiny and somewhat structured – like freshly wicked pads – while those right are uniform and maybe slightly convex.
  • The pads on the left board appear to be a bit larger. Different solder mask extension? (Look at the through hole or the pads of the IC on top left.)

Solderability of the board was excellent and after a few hours I had the board up and running.

Test Results

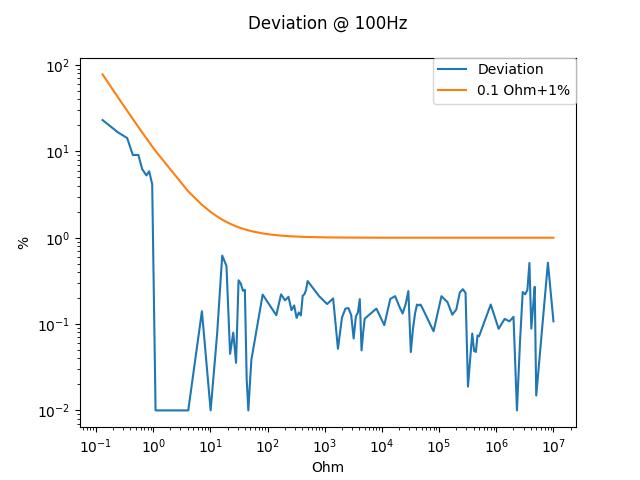
Deviation R @100Hz

The diagram above shows the resistance measurements at 100Hz taken on a dense grid of resistance values between 0.1 Ohm and 10 MOhm. The resistances were set by the decade resistor box I described in an earlier post.

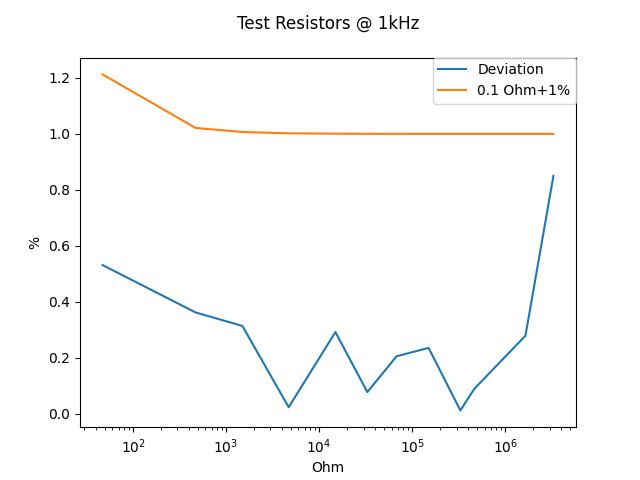
For higher frequencies I instead used a set of 12 fixed resistors with values between 47 Ohm and 3.3 MOhm to avoid effects due to the parasitic capacitance of the box.

The error increases for resistances above 1 MOhm.

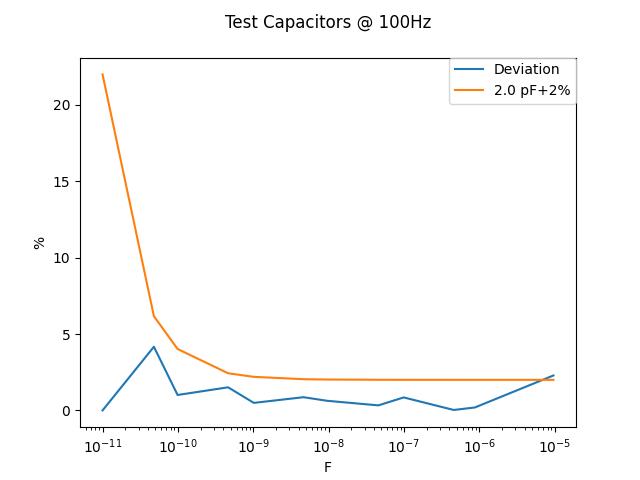
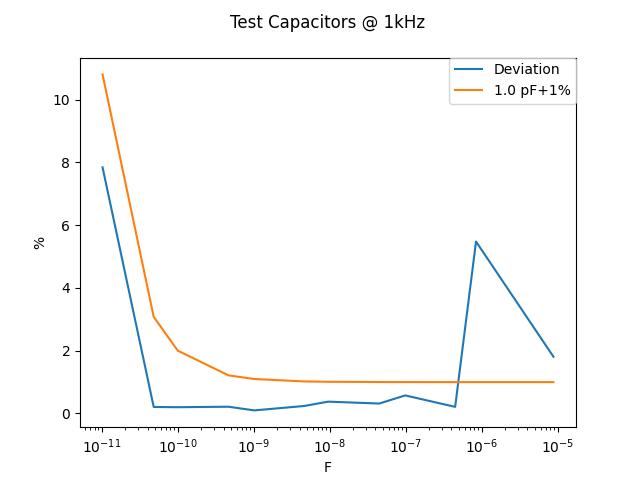
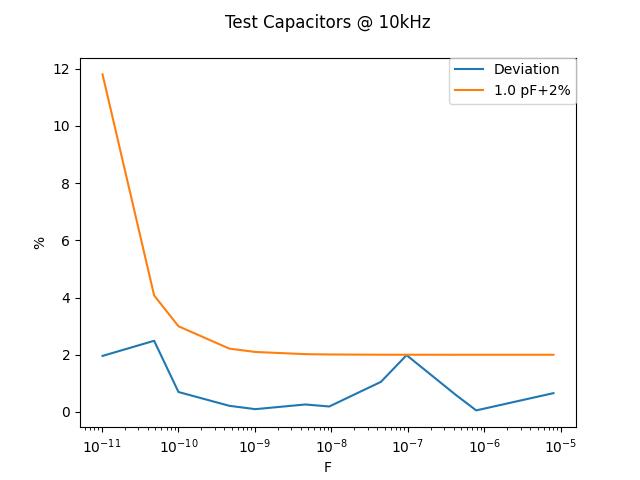
To test the phase calibration I prepared a set of capacitors whose values I measured with my DER EE DE-5000 LCR meter. The plots below show the results for measurements at 100 Hz, 1kHz and 10 kHz. Interestingly the 1µF electrolytic capacitor is measured with an error of 5% at 1 kHz but behaves inconspiciously at the other frequencies. This is something I need to investigate further.

Deviation C @ 100 Hz
Deviation C @ 1 kHz

Observations and Conclusions

The device is able to measure resistance and capacitance which in principle demonstrates the validity of the approach. However, there is room for improvement and further research

  • The deviations in the resistance measurement increase above 1MOhm
  • The accuracy of the capacity measurements for values > 10 µF can be improved
  • The glitch at 1uF and 1kHz is not yet understood
  • Measurements on inductances have not been performed yet

Most of the work for this project went into the calibration procedure for which I wrote Python functions. The zero calibration was moved from the very end of the computation to the beginning, right after reading the values from ADC which is more convenient from a software point of view.

The capacitors I used as references gave me a lot of headaches. I expected them to be somewhat stable which turned out not to be the case. For reliable measurements I had to measure the values of the components >100nF again every day as their values drifted (probably due to changing room temperatures). For the future I intend to get a set of film capacitors which should fix this problem.

When measuring small capacitances it is important to keep the test fixture stable. Moving a lead may already be enough to change the reading.