In this post we will introduce an additional calibration method and see how much this improves the measured deviation.
Calibration revisited
The deviations for small resistances are mostly due to parasitic trace and relay contact resistances. We tried to counteract these effects by calibrating the overall loop resistances for the “long loop” and the “short loop” and subtracting the estimated parasitic resistance from the set value to get to the relay configuration.
A brute force approach to calibrate the complete device would be to enumerate over all possible relay configurations from 0.1 to 999999.9, measure the resistances and use these stored values when we later want to set any resistance.
Clearly an impractical approach as the calibration procedure would take several years to complete and use much more memory than what we have avilable on the device.
However, as the deviations due to parasitics affect only set values up to around 50-100 Ohm it should be sufficient if we calibrate just this lower part of the resistance range.
New SCPI commands
For the new, additional calibration we need these three new SCPI commands.
| SOURce:RESistance:STAGe | Set resistance relay stage for bypass relay on or off |
| ADJustment:STAGe:COUNt?/qonly/ | Get the number of adjustment stages for the long loop. |
| ADJustment:STAGe:RESistance? | Set/get the adjustment value for bypass relay state and stage |
The calibration procedure will follow these steps:
Calibrate “short loop” with bypass relay = ON
For stage = 0 .. 9 (10 stages for the “short loop”)
- Send command SOURce:RESistance:STAGe ON, stage
- Measure resistance R
- Send command ADJustment:STAGe:RESistance ON, stage,R
Calibrate “long loop” with bypass relay = OFF
Send command ADJustment:STAGe:COUNt? to get N, the number of adjustment stages for the “long loop”.
For stage = 0 .. N-1 (N stages for the “long loop”)
- Send command SOURce:RESistance:STAGe OFF, stage
- Measure resistance R
- Send command ADJustment:STAGe:RESistance OFF, stage,R
Send command ADJustment:SAVe to store the calibration data.
Test Results
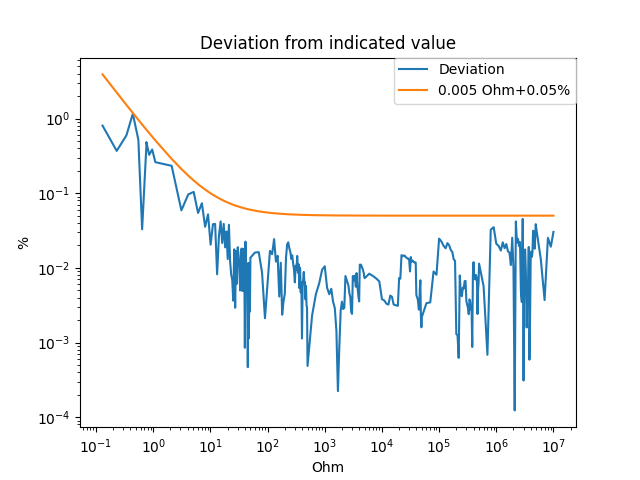
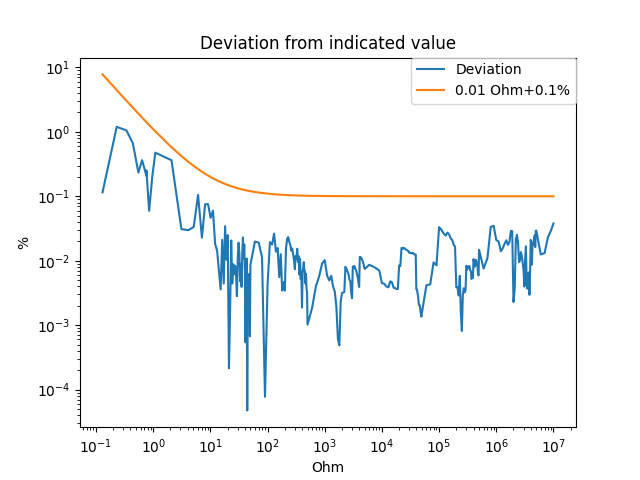
The diagram above shows the deviations from the indicated value using the additional calibration data. The deviations now stay safely below the line 0.01 Ohm +0.1% which is a significant improvement compared to the original test curve from post 2. Theoretically, for perfectly reproducably measurements, the deviations in the resistance range covered by the new calibration should be zero. However, due to variations in the measurement chain some deviations still remain, which shows the limitations of our setup.
In the horizontal region of the limit curve I am happy with the deviations given by the 0.1% resistors – especially as for resistances in the MOhm range the accuracy of my DMM is no longer better than that of the built-in resistors.
Pushing the Limits
If we measure extra slowly right after the calibration we can get the deviations down to below 0.005 Ohm + 0.05% although this probably won’t hold if the temperature changes and some time has passed since the last calibration.